- Analytics
- News and Tools
- Market News
CFD Markets News and Forecasts — 19-09-2018
| Raw materials | Closing price | % change |
| Oil | $71.37 | +2.18% |
| Gold | $1,208.50 | +0.47% |
| Index | Change items | Closing price | % change |
| Nikkei | +251.98 | 23672.52 | +1.08% |
| TOPIX | +25.78 | 1785.66 | +1.46% |
| Hang Seng | +322.71 | 27407.37 | +1.19% |
| CSI 300 | +43.05 | 3312.48 | +1.32% |
| KOSPI | -0.52 | 2308.46 | -0.02% |
| FTSE 100 | +30.89 | 7331.12 | +0.42% |
| DAX | +61.35 | 12219.02 | +0.50% |
| CAC 40 | +29.95 | 5393.74 | +0.56% |
| DJIA | +158.80 | 26405.76 | +0.61% |
| S&P 500 | +3.64 | 2907.95 | +0.13% |
| NASDAQ | -6.07 | 7950.0 | -0.08% |
| Pare | Closed | % change |
| EUR/USD | $1,1671 | +0,01% |
| GBP/USD | $1,3142 | -0,04% |
| USD/CHF | Chf0,9667 | +0,29% |
| USD/JPY | Y112,25 | -0,09% |
| EUR/JPY | Y131,03 | -0,08% |
| GBP/JPY | Y147,534 | -0,13% |
| AUD/USD | $0,7262 | +0,55% |
| NZD/USD | $0,6605 | +0,28% |
| USD/CAD | C$1,29263 | -0,40% |
Major US stock indices showed mixed dynamics: the S & P 500 and Dow Jones grew, supported by optimistic housing market data and a rise in the price of bank shares, caused by the growth of bond yields, while the fall of Microsoft put pressure on the Nasdaq index.
As it became known, the demand for new houses is strong, but the new construction activity was slow and uneasy. The laying of new houses in August amounted to 1.282 million in view of seasonal fluctuations, the Ministry of Commerce reported. This is 9.2% higher than in July, and 9.4% higher than a year ago. Builders of housing in August laid more houses, which was good news for a starving housing market. The pace in August exceeded the consensus forecast of 1.235 million. But they applied for fewer permits: 1.229 million permits in August. They decreased by 5.7% per month and by 5.5% compared to the previous year.
Oil futures have risen in price, fueled by concerns that producers may not cover the supply deficit as soon as US sanctions against Iran take effect in November. Support prices also provided fresh data from the US Energy Ministry for oil products, according to which, for the week to September 14, oil reserves fell by 2.057 million barrels, to 394.137 million barrels. Analysts had expected a decline in inventories at 2.741 million barrels.
Most components of DOW have finished trading in positive territory (21 out of 30). Leader of the growth were shares of JPMorgan Chase & Co. (JPM, + 3.08%). Outsider were the shares of Verizon Communications Inc. (VZ, -1.71%).
S & P sectors demonstrated mixed dynamics. The financial sector grew most (+ 1.0%). The utilities sector showed the greatest decrease (-1.8%).
At closing:
Dow 26,405.76 +158.80 + 0.61%
S & P 500 2,907.95 +3.64 +0.13%
Nasdaq 100 7,950.04 -6.07 -0.08%
U.S. commercial crude oil inventories (excluding those in the Strategic Petroleum Reserve) decreased by 2.1 million barrels from the previous week. At 394.1 million barrels, U.S. crude oil inventories are about 3% below the five year average for this time of year.
Total motor gasoline inventories decreased by 1.7 million barrels last week and are about 8% above the five year average for this time of year. Finished gasoline inventories increased while blending components inventories decreased last week.
Distillate fuel inventories increased by 0.8 million barrels last week and are about 2% below the five year average for this time of year. Propane/propylene inventories increased by 0.1 million barrels last week and are about 12% below the five year average for this time of year. Total commercial petroleum inventories decreased last week by 0.4 million barrels last week.
U.S. stock-index futures edged down on Wednesday, after an unexpected rallied in the stock market the day before, despite the latest tit-for-tat tariffs between the U.S. and China
Global Stocks:
| Index/commodity | Last | Today's Change, points | Today's Change, % |
| Nikkei | 23,672.52 | +251.98 | +1.08% |
| Hang Seng | 27,407.37 | +322.71 | +1.19% |
| Shanghai | 2,730.85 | +30.90 | +1.14% |
| S&P/ASX | 6,190.00 | +28.50 | +0.46% |
| FTSE | 7,311.52 | 11.29 | +0.15% |
| CAC | 5,374.50 | +10.71 | +0.20% |
| DAX | 12,171.74 | +14.07 | +0.12% |
| Crude | $69.81 | | -0.06% |
| Gold | $1,210.10 | | +0.59% |
(company / ticker / price / change ($/%) / volume)
| ALCOA INC. | AA | 43.2 | 0.37(0.86%) | 2819 |
| ALTRIA GROUP INC. | MO | 62.46 | 0.02(0.03%) | 220 |
| Amazon.com Inc., NASDAQ | AMZN | 1,925.50 | 17.47(0.92%) | 59687 |
| Apple Inc. | AAPL | 218.94 | 1.06(0.49%) | 267958 |
| AT&T Inc | T | 33.59 | -0.03(-0.09%) | 7015 |
| Barrick Gold Corporation, NYSE | ABX | 10.4 | 0.05(0.48%) | 13187 |
| Boeing Co | BA | 357.32 | 1.36(0.38%) | 6058 |
| Caterpillar Inc | CAT | 147.2 | 0.98(0.67%) | 6919 |
| Chevron Corp | CVX | 118 | 0.49(0.42%) | 1368 |
| Cisco Systems Inc | CSCO | 47.22 | 0.11(0.23%) | 1996 |
| Citigroup Inc., NYSE | C | 71.19 | 0.31(0.44%) | 4855 |
| Exxon Mobil Corp | XOM | 83.8 | 0.39(0.47%) | 5904 |
| Facebook, Inc. | FB | 159.5 | -1.08(-0.67%) | 222691 |
| FedEx Corporation, NYSE | FDX | 249 | -6.73(-2.63%) | 10825 |
| Ford Motor Co. | F | 9.5 | -0.05(-0.52%) | 31559 |
| Freeport-McMoRan Copper & Gold Inc., NYSE | FCX | 14 | 0.28(2.04%) | 65412 |
| General Electric Co | GE | 12.64 | -0.06(-0.47%) | 60091 |
| General Motors Company, NYSE | GM | 35 | -0.02(-0.06%) | 8972 |
| Goldman Sachs | GS | 228.69 | 0.80(0.35%) | 1723 |
| Google Inc. | GOOG | 1,158.90 | 2.85(0.25%) | 2793 |
| Hewlett-Packard Co. | HPQ | 25.1 | 0.09(0.36%) | 150 |
| Home Depot Inc | HD | 209 | 0.60(0.29%) | 1719 |
| HONEYWELL INTERNATIONAL INC. | HON | 164.13 | -1.62(-0.98%) | 301 |
| Intel Corp | INTC | 45.62 | 0.20(0.44%) | 10792 |
| International Business Machines Co... | IBM | 148 | 0.06(0.04%) | 1146 |
| JPMorgan Chase and Co | JPM | 114.22 | 0.38(0.33%) | 17946 |
| Merck & Co Inc | MRK | 70.45 | 0.03(0.04%) | 745 |
| Microsoft Corp | MSFT | 112.58 | 0.44(0.39%) | 51864 |
| Nike | NKE | 83.75 | 0.49(0.59%) | 4091 |
| Pfizer Inc | PFE | 42.95 | -0.06(-0.14%) | 600 |
| Starbucks Corporation, NASDAQ | SBUX | 54.45 | -0.12(-0.22%) | 3243 |
| Tesla Motors, Inc., NASDAQ | TSLA | 297.2 | 2.36(0.80%) | 29837 |
| The Coca-Cola Co | KO | 46.48 | 0.16(0.35%) | 2427 |
| Twitter, Inc., NYSE | TWTR | 28.8 | -0.06(-0.21%) | 66444 |
| United Technologies Corp | UTX | 136.94 | -0.82(-0.60%) | 453 |
| Visa | V | 146.55 | 0.37(0.25%) | 2231 |
| Wal-Mart Stores Inc | WMT | 95.45 | 0.63(0.66%) | 3915 |
| Yandex N.V., NASDAQ | YNDX | 31.59 | 0.50(1.61%) | 7127 |
Intel (INTC) target lowered to $50 from $56 at Morgan Stanley
The U.S. current-account deficit decreased to $101.5 billion (preliminary) in the second quarter of 2018 from $121.7 billion (revised) in the first quarter of 2018, according to statistics released by the Bureau of Economic Analysis (BEA). The deficit was 2.0 percent of current-dollar gross domestic product (GDP) in the second quarter, down from 2.4 percent in the first quarter.
The $20.3 billion decrease in the current-account deficit reflected a $17.6 billion decrease in the deficit on goods, a $2.5 billion increase in the surplus on services, and relatively small and offsetting changes in the balances on primary income and secondary income.
Goods exports increased $17.8 billion to $429.2 billion, mostly reflecting increases in industrial supplies and materials, primarily petroleum and products, and in foods, feeds, and beverages, primarily soybeans.
Imports of goods and services and income payments increased $7.7 billion in the second quarter to $1,034.7 billion.
Privately-owned housing units authorized by building permits in August were at a seasonally adjusted annual rate of 1,229,000. This is 5.7 percent below the revised July rate of 1,303,000 and is 5.5 percent below the August 2017 rate of 1,300,000. Single-family authorizations in August were at a rate of 820,000; this is 6.1 percent below the revised July figure of 873,000. Authorizations of units in buildings with five units or more were at a rate of 370,000 in August.
Privately-owned housing starts in August were at a seasonally adjusted annual rate of 1,282,000. This is 9.2 percent above the revised July estimate of 1,174,000 and is 9.4 percent above the August 2017 rate of 1,172,000. Single-family housing starts in August were at a rate of 876,000; this is 1.9 percent above the revised July figure of 860,000. The August rate for units in buildings with five units or more was 392,000
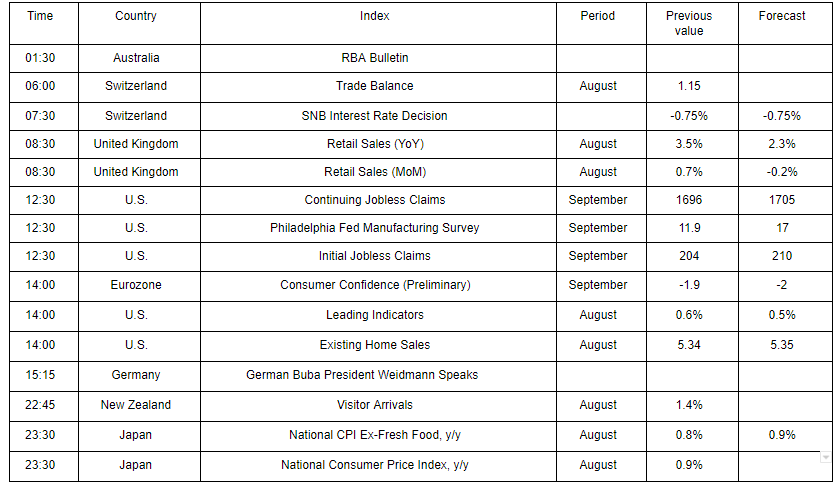
UK house prices rose by 3.1% in the year to July 2018, down slightly from 3.2% in the year to June 2018. This is the lowest UK annual rate since August 2013 when it was 3.0%.
House prices grew fastest in the North West region, increasing by 5.6% in the year to July 2018, followed by the South West and the West Midlands, both increasing by 4.4% over the year. House prices in London fell by 0.7% in the year to July 2018, down from an increase of 0.3% in the previous month.
The headline rate of output inflation for goods leaving the factory gate was 2.9% on the year to August 2018, down from 3.1% in July 2018.
The growth rate of prices for materials and fuels for manufacturing (input prices) slowed to 8.7% on the year to August 2018, down from 10.3% in July 2018.
All product groups provided upward contributions to output annual inflation; the largest contribution for the fourth consecutive month was made by petroleum products.
Annual inflation remained positive for both input and output indices for the 26th consecutive month.
The Consumer Prices Index including owner occupiers' housing costs (CPIH) 12-month inflation rate was 2.4% in August 2018, up from 2.3% in July 2018.
Rising prices for a range of recreational and cultural goods and services, transport services and clothing produced the largest upward contributions to the change in the rate between July and August 2018.
Partially offsetting downward contributions came from furniture and household goods, and telecommunications; prices for these rose between July and August 2018 but by less than a year ago.
The Consumer Prices Index (CPI) 12-month rate was 2.7% in August 2018, up from 2.5% in July 2018.
In July 2018 the current account of the euro area recorded a surplus of €21 billion, compared with a surplus of €24 billion in June 2018.
In the 12-month period to July 2018, the current account recorded a surplus of €394 billion (3.5% of euro area GDP), compared with one of €358 billion (3.3% of euro area GDP) in the 12-month period to July 2017.
In the financial account, euro area residents made net acquisitions of foreign portfolio investment securities of €474 billion in the 12-month period to July 2018 (decreasing from €497 billion in the 12 months to July 2017).
Non-residents' net purchases of euro area portfolio investment securities amounted to €127 billion (down from €212 billion in the 12-month period to July 2017).
-
Global economic growth is also continuing
-
The inflation will gradually move to the target level of 2%
-
It's too early to judge the effect of the July policy change on the bond market
-
The summer period usually has less commercial activity
-
Decrease in the number of ETF purchases in August does not mean a shift in policy
-
It is necessary to continue the current strong easing of monetary policy
EUR/USD
Resistance levels (open interest**, contracts)
$1.1797 (3633)
$1.1782 (1682)
$1.1758 (608)
Price at time of writing this review: $1.1691
Support levels (open interest**, contracts):
$1.1616 (3854)
$1.1577 (5721)
$1.1535 (3108)
Comments:
- Overall open interest on the CALL options and PUT options with the expiration date October, 15 is 90405 contracts (according to data from September, 18) with the maximum number of contracts with strike price $1,1600 (5721);
GBP/USD
Resistance levels (open interest**, contracts)
$1.3249 (2497)
$1.3223 (1711)
$1.3207 (720)
Price at time of writing this review: $1.3160
Support levels (open interest**, contracts):
$1.3099 (1012)
$1.3072 (508)
$1.3040 (752)
Comments:
- Overall open interest on the CALL options with the expiration date October, 15 is 27254 contracts, with the maximum number of contracts with strike price $1,3200 (2885);
- Overall open interest on the PUT options with the expiration date October, 15 is 31735 contracts, with the maximum number of contracts with strike price $1,2800 (2486);
- The ratio of PUT/CALL was 1.16 versus 1.12 from the previous trading day according to data from September, 18.
* - The Chicago Mercantile Exchange bulletin (CME) is used for the calculation.
** - Open interest takes into account the total number of option contracts that are open at the moment.
Japan posted a 444.594 billion yen trade deficit in August,according to rttnews.
That beat forecasts for a shortfall of 483.2 billion yen following the 231.9 billion yen deficit in July.
Exports climbed 6.6 percent on year to 6.691 trillion yen - exceeding expectations for 5.2 percent and up from 3.9 percent in the previous month.
Imports jumped an annual 15.4 percent to 7.136 trillion yen versus forecasts for 14.5 percent and up from 14.6 percent a month earlier.
New Zealand's seasonally adjusted current account deficit was $2.7 billion in the June 2018 quarter, $484 million narrower than in the March 2018 quarter.
The annual current account deficit increased to $9.5 billion for the year ended June 2018 (3.3% of GDP), up from the $7.1 billion deficit for the June 2017 year (2.6% of GDP).
In the June 2018 quarter:
-
The seasonally adjusted goods deficit narrowed to $1.4 billion (down $332 million.
-
The seasonally adjusted services surplus increased to $1.5 billion (up $146 million).
-
The primary income deficit narrowed to $2.5 billion (down $118 million).
-
The financial account had a net outflow of $1.7 billion.
At 30 June 2018:
-
Our net international liability position was $157.9 billion (54.6% of GDP), similar to the $156.2 billion (54.6% of GDP) at 31 March 2018.
-
Our net external debt was $150.8 billion (52.1% of GDP), up from $150.2 billion (52.5% of GDP) at 31 March 2018.
-
Households are particularly concerned about the outlook for their own finances and the general economy over the next year.
-
This comes despite the Government's Families package, which was initiated in July. This has presumably been outweighed by other concerns, such as rising petrol prices and cooling housing markets.
-
These results present a challenge to our expectation that the economy will regain some momentum in the short term on the back of Government spending.
-
Households' inclination to save remains low.
The Bank of Japan maintains a short-term target interest rate of -0.1%, and a 10-year target profit of JGB around zero percent.
The central bank leaves unchanged the forecast for rates and says it will keep the current extremely low rates for a long period of time.
Also, the central bank leaves unchanged the promise to buy JGB in a flexible way, so its reserves increase at an annual rate of about Y80 trillion.
The Bank supports the promise that its purchase of ETF, J-REIT will fluctuate to some extent depending on economic and price changes.
The Bank of Japan did not change its assessment of the economy, saying that Japan's economy is growing moderately.
The decision of the Bank of Japan to manage the yield curve was taken by a vote of 7 to 2. Members of the board Kataok and Harada were against it.
Board member Harada said that "allowing fluctuations in the yield of government bonds in a wider range, the central bank gives ambiguous signals." "The leading indication of the central bank should be more clearly tied to the target inflation rate," Harada said.
Kataoka did not agree with the view that inflation would reach the target level of 2%. He also said that "the central bank should lower the target level of return on 10-year government bonds and longer-term debt securities"
Economic forecasts by the Federal Government's Expert Group - autumn 2018. The Expert Group is significantly raising its forecast for GDP growth in 2018 from 2.4% to 2.9%. The favourable international economic development is stimulating foreign trade, and companies are investing heavily. The forecast for GDP growth in 2019 remains unchanged at robust 2.0%. However, the negative risks significantly outweigh the positives and threaten the global outlook.


© 2000-2024. All rights reserved.
This site is managed by Teletrade D.J. LLC 2351 LLC 2022 (Euro House, Richmond Hill Road, Kingstown, VC0100, St. Vincent and the Grenadines).
The information on this website is for informational purposes only and does not constitute any investment advice.
The company does not serve or provide services to customers who are residents of the US, Canada, Iran, The Democratic People's Republic of Korea, Yemen and FATF blacklisted countries.
Making transactions on financial markets with marginal financial instruments opens up wide possibilities and allows investors who are willing to take risks to earn high profits, carrying a potentially high risk of losses at the same time. Therefore you should responsibly approach the issue of choosing the appropriate investment strategy, taking the available resources into account, before starting trading.
Use of the information: full or partial use of materials from this website must always be referenced to TeleTrade as the source of information. Use of the materials on the Internet must be accompanied by a hyperlink to teletrade.org. Automatic import of materials and information from this website is prohibited.
Please contact our PR department if you have any questions or need assistance at pr@teletrade.global.
transfers