- Analytics
- News and Tools
- Market News
CFD Markets News and Forecasts — 14-03-2019
| Time | Country | Event | Period | Previous value | Forecast |
|---|---|---|---|---|---|
| 00:00 | Australia | Consumer Inflation Expectation | March | 3.7% | |
| 03:00 | Japan | BoJ Interest Rate Decision | -0.1% | -0.1% | |
| 06:30 | Japan | BOJ Press Conference | |||
| 08:55 | Japan | BOJ Governor Haruhiko Kuroda Speaks | |||
| 10:00 | Eurozone | Harmonized CPI ex EFAT, Y/Y | February | 1.1% | 1% |
| 10:00 | Eurozone | Harmonized CPI | February | -1% | 0.3% |
| 10:00 | Eurozone | Harmonized CPI, Y/Y | February | 1.4% | 1.5% |
| 12:30 | Canada | Manufacturing Shipments (MoM) | January | -1.3% | 0.4% |
| 12:30 | U.S. | NY Fed Empire State manufacturing index | March | 8.8 | 10 |
| 13:15 | U.S. | Capacity Utilization | February | 78.2% | 78.4% |
| 13:15 | U.S. | Industrial Production YoY | February | 3.8% | |
| 13:15 | U.S. | Industrial Production (MoM) | February | -0.6% | 0.4% |
| 14:00 | U.S. | JOLTs Job Openings | January | 7.335 | 7.31 |
| 14:00 | U.S. | Reuters/Michigan Consumer Sentiment Index | March | 93.8 | 95.3 |
| 17:00 | U.S. | Baker Hughes Oil Rig Count | March | 834 | |
| 20:00 | U.S. | Total Net TIC Flows | January | -33.1 | |
| 20:00 | U.S. | Net Long-term TIC Flows | January | -48.3 |
Major US stock indices predominantly declined amid concerns about the delay in trade negotiations between the United States and China, as well as weaker than expected US data.
The agency Bloomberg News reported that China and the United States are trying to postpone the meeting of the leaders of the two countries from late March to April. The message appeared the next day, after Trump announced that he was not in a hurry to conclude an agreement. Investors had expected the two leaders to meet in Mar-a-Lago at the end of this month, since both sides claimed that progress had been made in trade negotiations.
The Ministry of Labor reported that initial claims for unemployment benefits rose by 6,000 to 229,000, taking into account seasonal fluctuations for the week ending March 9. The data for the previous week was unchanged. Economists predicted that the number of applications will increase to 225,000. The number of applications for benefits fluctuates in the middle of their range of 200,000–253,000 this year.
Meanwhile, the Commerce Department reported that in January, sales of new homes fell by 6.9% to a seasonally adjusted annual figure of 607,000 units, which was below the experts' forecast (620,000), suggesting that the housing market was weak at the beginning of the first quarter. The report showed a sharp decline in new home sales in the Midwest, which fell by 28.6%, while sales of new homes in the South and Northeast fell by 15.1% and 11.4%, respectively. On the other hand, sales of new homes in the West increased by 27.8% over the month. The average selling price of new homes sold in January was $ 317,200, which is 0.6% less than $ 319,100 in December and 3.8% less than $ 329,600 a year earlier. The report also says that stocks of new homes for sale at the end of January amounted to 336,000 units, which corresponds to 6.6 months of supply at the current level of sales.
Most of the components of DOW finished trading in positive territory (20 of 30). The growth leader was the shares of Visa Inc. (V, + 1.34%). Pfizer Inc. shares turned out to be an outsider. (PFE; -1.92%).
Almost all sectors of the S & P recorded a decline. The largest decline was shown by the industrial goods sector (-0.3%). Growth was recorded only in the financial sector (+ 0.2%) and the consumer goods sector (+ 0.1%).
At the time of closing:
Dow 25,709.73 +6.84 +0.03%
S & P 500 2,808.49 -2.43 -0.09%
Nasdaq 100 7,630.91 -12.49 -0.16%
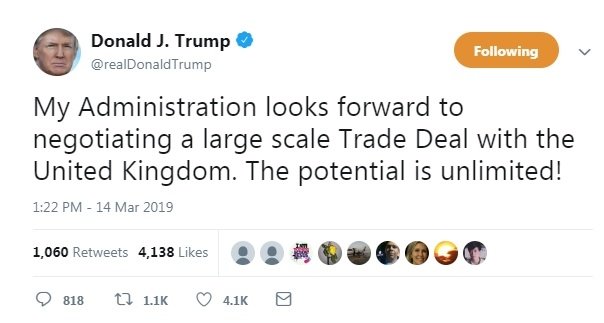
- Would like to see Brexit worked out, wants a trade deal with the UK
- Does not think another vote on Brexit would be possible because it would be unfair
- Prime Minister May didn't listen to his suggestions on how to negotiate Brexit
- Brexit is very complex, tearing a lot of countries apart
- EU has been very tough to deal with
- Trump also threatened to put tariffs on EU cars
- Cannot say if there will be a final deal
- Warned that falling business investment driven by prolonged economic uncertainty risks harming the UK’s strong jobs market
- Brexit presented a particular challenge to central bankers in that it potentially reduced the UK’s ability to produce goods and services while simultaneously lowering spending
The U.S. Commerce Department announced on Thursday that the sales of new single-family homes plummeted 6.9 percent m-o-m to a seasonally adjusted annual rate of 607, 000 units in January, suggesting the housing market weakness persisted early this year, despite a moderation in mortgage rates. That was the slowest pace since October 2018.
Economists had forecast the sales pace of 620,000 last month.
December’s sales pace was revised up to 652,000 units from the originally reported 621,000 units.
According to the report, new home sales in the South, the largest area, tumbled 15.1 percent m-o-m. Sales in the Midwest plummeted 28.6 percent m-o-m to the lowest level since January 2014, while sales in the Northeast dropped 11.4 percent m-o-m. Meanwhile, sales in the West surged 27.8 percent to a 10-month high.
In y-o-y terms, new home sales recorded a 4.1percent drop in January.
Statistics Canada reported on Thursday the New Housing Price Index (NHPI) edged down 0.1 percent m-o-m in January, following five consecutive months of unchanged prices.
Economists had forecast the NHPI to be flat m-o-m in January.
According to the report, four of the largest new housing markets in the country reported drops in January, ranging from -0.1 percent m-o-m in Vancouver and Edmonton to -0.2 percent m-o-m in Toronto and Calgary, due to lower negotiated selling prices and unfavorable market conditions.
At the same time, eight census metropolitan areas (CMAs) reported gains in January, with Halifax and Trois-Rivières posting the largest increases, both up 0.3 percent m-o-m as a result of higher construction costs.
In y-o-y terms, NHPI fell 0.1 percent in January, recording the first 12-month decrease in more than nine years.
U.S. stock-index flat on Thursday, as investors grapple with some key corporate news and additional economic weakness out of China, as well as reports that a trade meeting between theS. President Donald Trump and Chinese President Xi Jinping will be pushed back.
Global Stocks:
Index/commodity | Last | Today's Change, points | Today's Change, % |
Nikkei | 21,287.02 | -3.22 | -0.02% |
Hang Seng | 28,851.39 | +43.94 | +0.15% |
Shanghai | 2,990.69 | -36.27 | -1.20% |
S&P/ASX | 6,179.60 | +18.40 | +0.30% |
FTSE | 7,192.27 | +33.08 | +0.46% |
CAC | 5,341.10 | +34.72 | +0.65% |
DAX | 11,617.64 | +45.23 | +0.39% |
Crude | $58.48 | +0.38% | |
Gold | $1,296.10 | -1.01% |
(company / ticker / price / change ($/%) / volume)
ALTRIA GROUP INC. | MO | 56 | -0.13(-0.23%) | 11858 |
Amazon.com Inc., NASDAQ | AMZN | 1,695.50 | 4.69(0.28%) | 35080 |
Apple Inc. | AAPL | 183.94 | 2.23(1.23%) | 321411 |
AT&T Inc | T | 30.35 | 0.07(0.23%) | 19729 |
Boeing Co | BA | 375 | -2.14(-0.57%) | 152918 |
Caterpillar Inc | CAT | 132.5 | -1.00(-0.75%) | 1840 |
Cisco Systems Inc | CSCO | 52.77 | 0.18(0.34%) | 9507 |
Citigroup Inc., NYSE | C | 63.97 | 0.32(0.50%) | 20998 |
Exxon Mobil Corp | XOM | 80.72 | 0.01(0.01%) | 1415 |
Facebook, Inc. | FB | 170.6 | -2.77(-1.60%) | 371221 |
Ford Motor Co. | F | 8.52 | -0.01(-0.12%) | 24419 |
Freeport-McMoRan Copper & Gold Inc., NYSE | FCX | 12.41 | -0.25(-1.98%) | 17821 |
General Electric Co | GE | 10.3 | 0.28(2.79%) | 6054526 |
Goldman Sachs | GS | 197.89 | 0.64(0.32%) | 1408 |
Google Inc. | GOOG | 1,192.48 | -0.84(-0.07%) | 1802 |
Hewlett-Packard Co. | HPQ | 19.68 | 0.07(0.36%) | 7060 |
Home Depot Inc | HD | 181.38 | 0.24(0.13%) | 2096 |
Intel Corp | INTC | 54.41 | 0.04(0.07%) | 9003 |
International Business Machines Co... | IBM | 138.71 | 0.15(0.11%) | 2267 |
Johnson & Johnson | JNJ | 137.5 | -1.91(-1.37%) | 32474 |
JPMorgan Chase and Co | JPM | 104.65 | 0.26(0.25%) | 9014 |
McDonald's Corp | MCD | 182.15 | 0.09(0.05%) | 329 |
Microsoft Corp | MSFT | 114.75 | 0.25(0.22%) | 766636 |
Nike | NKE | 86.11 | 0.18(0.21%) | 1168 |
Pfizer Inc | PFE | 41.96 | -0.05(-0.12%) | 2927 |
Procter & Gamble Co | PG | 101.2 | 0.02(0.02%) | 462 |
Starbucks Corporation, NASDAQ | SBUX | 70.27 | 0.17(0.24%) | 2499 |
Tesla Motors, Inc., NASDAQ | TSLA | 292 | 3.04(1.05%) | 88352 |
The Coca-Cola Co | KO | 45.86 | 0.04(0.09%) | 7731 |
Verizon Communications Inc | VZ | 57.75 | 0.09(0.16%) | 2661 |
Visa | V | 152.74 | 0.27(0.18%) | 4633 |
Wal-Mart Stores Inc | WMT | 98.55 | 0.05(0.05%) | 6622 |
Walt Disney Co | DIS | 114.06 | -0.03(-0.03%) | 7910 |
Yandex N.V., NASDAQ | YNDX | 35.8 | 0.08(0.22%) | 476 |
The Labor Department reported the import-price index, measuring the cost of goods ranging from Canadian oil to Chinese electronics, rose 0.6 percent m-o-m in February, following a revised 0.1-percent m-o-m increase in January (originally a 0.5 percent decline). That was the largest monthly advance in import prices since May last year. Economists had expected prices to gain 0.3 percent m-o-m last month.
According to the report, prices for import fuel rose 4.9 percent in February, after advancing 4.1 percent in January, as prices for both petroleum and natural gas increased. Meanwhile, nonfuel import prices recorded no change in February following a 0.3-percent drop in January, as rising prices for consumer goods and nonfuel industrial supplies and materials offset declining prices for foods, feeds, and beverages and capital goods.
Over the 12-month period ended in February, import prices dropped 1.3 percent, weighed down by declines in both fuel and nonfuel prices.
At the same time, the price index for U.S. exports surged 0.6 percent m-o-m in February, following a revised 0.5 percent m-o-m drop in the previous month (originally a 0.6 percent decrease).
Both nonagricultural prices (+0.7 percent m-o-m) and agricultural prices (+0.3 percent m-o-m) contributed to the February advance.
Over the past 12 months, the price index for exports rose 0.3 percent, driven by higher nonagricultural prices.
Apple (AAPL) initiated with a Outperform at Cowen; target $220
The data from the Labor Department revealed the number of applications for unemployment benefits rose last week, a sign the labor market may be softening somewhat even as it remains strong overall.
According to the report, the initial claims for unemployment benefits increased 6,000 to 229,000 for the week ended March 9.
Economists had expected 225,000 new claims last week.
Claims for the prior week were remained unchanged at 223,000.
Meanwhile, the four-week moving average of claims dropped fell by 2,500 to 223,750 last week
- Discussions on backstop are said to be over
- May would put her deal to a third vote if it is "worthwhile"
- No talks with the EU at the moment
- PM has made clear that she won't revoke Article 50
- EU-27 would have to decide unanimously on an extension if one is requested
- If the UK is still a member of the EU at the time of EU elections, it would have to take part in them
- Would not describe long extension as restarting Brexit talks
- The long extension would give UK a long reflection period about kind of Brexit it wants
- Thinks UK will get the extension so long as there is a plan to go along with that
- Notes the long extension of 21 months as a possibility
U.S. President Donald Trump said he was in no rush to complete a trade pact with China and insisted that any deal include protection for intellectual property, a major sticking point between the two sides during months of negotiations.
Trump and Chinese President Xi Jinping had been expected to hold a summit at the president's Mar-a-Lago property in Florida later this month, but no date has been set for a meeting and no in-person talks between their trade teams have been held in more than two weeks.
China will allow cities to set their own property taxes instead of requiring them to conform to one tax regime, a senior lawmaker said.
China's residential property market is deeply segmented and polarised, with prices many times higher in so-called tier-one cities such as Beijing and Shanghai compared with markets in hinterland cities. The huge price variations make it hard to create one tax regime that can apply to all markets.
Allowing local governments to decide their own property tax rates will also minimise their potential impact on housing prices, said Yin Zhongqing, deputy director of the financial and economic affairs committee at the National People's Congress.
Previously, the Trump-Xi meeting on the ongoing trade talks was scheduled some time this month.
during any extended period, Britain would remain a full EU member state
UK government cites during any extension Britain could not start negotiations on future EU relationship
if requesting an extension, would be appropriate for PM May to write to EU’S Tusk to set out why and for how long
Iris Pang, economist at ING, notes that China’s fixed asset investment increased by 6.1% year-on-year, year-to-date in February, faster than the 5.9% rate in December.
“Infrastructure investment grew 4.3%YoY YTD in February, 0.5 percentage points higher than the average rate in 2018. The impact of fiscal stimulus on infrastructure investment is likely to become even more obvious as the year goes on, and will be the main driver of economic growth in 2019. This will be particularly true if there is no imminent agreement on a trade deal.”
Germany's Ifo institute has slashed its 2019 growth forecast for Europe's largest economy to 0.6 percent from 1.1 percent due to weaker foreign demand for industrial goods. However,Ifo see the weakness as being short-lived and expects a rebound to 1.8 percent growth in 2020.
"Industry won't drive overall growth. Global demand for German products is weak because the world economy is losing further steam," Ifo economist Timo Wollmershaeuser said.
According to data released on Thursday, China's central bank continued to sell its holdings of foreign exchange in February, but by a much smaller amount.
The People's Bank of China said it sold a net 330 million yuan ($49.2 million) of foreign exchange in February, leaving the total forex purchase position at 21.25 trillion yuan ($3.168 trillion). In January, the central bank sold a net 1.21 billion yuan.
German economy had subdued start to 2019, points to higher risks and uncertainties abroad
solid domestic demand and fiscal impetus are providing support for economy
weak phase in industrial sector is likely to continue due to weak demand from abroad
problems in car sector related to new emissions standards should be largely overcome now
NAB discusses NZD/JPY technical outlook and maintains a neutral bias in the near-term.
"Price has held a MT downtrend structure of lower highs / lower lows since mid-2017. A break above the Q4 2018 high at 78.86 is required to break the MT downtrend structure. A weekly close above 78.86 will be a strong bullish confirmation as it will also break above the 100- and 200-week MA’s and weekly Bollinger band. Weekly closes have held above the 50-week MA (now 75.45) for four weeks. A weekly close below 75.45 will highlight a failing interim uptrend."
If there is no consensus behind May's deal, lawmakers have to decide on alternative
It is clear that lawmakers who voted against May's deal are thinking it over again
some Tory lawmakers who rejected the deal are reconsidering
lawyers are coming out with more reflections on the deal and Cox may want to consider what they are saying
there is not a majority in parliament for second referendum
According to Karen Jones, analyst at Commerzbank, EUR/GBP’s new low of 0.8471 has not been confirmed by the daily RSI and it should allow for another test of the accelerated downtrend at .8657.
“While capped here downside risk remains for losses to the 200 week MA at 0.8384. It is on the defensive. Above the downtrend, rallies are likely to find initial resistance at 0.8722 (22nd February high) ahead of 0.8761, 0.8849 (55 and 200 day MA). The market is expected to struggle on rallies to the 200 day MA at 0.8849, and only above here allows for a move to the October 0.8941 high, which is expected to contain the topside.”
According to the report from Insee, in February 2019, the Consumer Prices Index (CPI) was stable over a month, after a 0.4% downturn in December. The rebound in energy prices (+1.3% after −1.2%) was offset by a decline in fresh food prices (−1.3% after +2.4%) and the lesser drop in manufactured product prices (−0.4% after −2.1%). At last, the prices of services are stable in February.
Seasonally adjusted, consumer prices were stable over a month, after +0.2% in January.
Year on year, consumer prices increased by 1.3% in February 2019, after +1.2% in January. This slight rise in inflation came from a year-on-year acceleration in energy and food prices, partly offset by a slowdown in services prices and a higher decrease in those of manufactured products.
Year on year, core inflation was unchanged to +0.7%, as in the three previous months. The Harmonised Index of Consumer Prices (HICP) rebounded to +0.1% over a month in February, after −0.6% in January; year on year, it grew by 1.6%, after +1.4% in the previous month.
According to the report from Federal Statistical Office (FSO), the Producer and Import Price Index increased in February 2019 by 0.2% compared with the previous month, reaching 101.9 points (December 2015 = 100). The rise is due in particular to higher prices for petroleum products. Compared with February 2018, the price level of the whole range of domestic and imported products fell by 0.7%. Economists had expected a 1.0% decrease.
Federal Statistical Office (Destatis) said, consumer prices in Germany were up 1.5% in February 2019 from February 2018. Economists had expected a 1.6% increase. The inflation rate - measured by the consumer price index - was thus slightly higher year on year than in January 2019 (+1.4%).
Energy prices were 2.9% higher in February 2019 than a year earlier and had a slight upward effect on the overall inflation rate. A closer look at the individual energy products reveals that the prices of electricity, gas and other fuels were up 4.3% in February 2019 from February 2018. The highest price increase was recorded for heating oil (+14.2%). Motor fuel prices rose by only 0.1% over the same period. Excluding energy prices, the rate of inflation would have been +1.4% in February 2019.
Compared with January 2019, the consumer price index rose by 0.4% in February 2019. Economists had expected a 0.5% increase. Package holiday prices were markedly up in February 2019 on the previous month (+10.7%). Higher prices than in January 2019 were recorded also for clothing (+3.6%), plants and flowers (+2.4%). The prices of food (total) increased by 0.5% in February 2019 month on month. This was mainly due to the considerable rise in vegetable prices (+3.6%). The prices of energy (total) increased only slightly from the previous month (+0.2%) in February 2019. A month-on-month increase in prices was recorded especially for heating oil (+1.1%). The price of motor fuel, in contrast, was somewhat lower (-0.2%). However, the prices of the individual motor fuels showed diverging trends (for instance, supergrade petrol: -0.7%, but diesel fuel: +1.0%).
Swiss government cuts 2019 growth forecast to 1.1% from 1.5%
Swiss government keeps 2020 growth forecast unchanged at 1.7%
Swiss government cites weaker global, german growth
Swiss government cuts 2019 inflation forecast to 0.4% from 0.5%
Swiss government cuts 2020 inflation forecast to 0.6% from 0.7%
EUR/USD
Resistance levels (open interest**, contracts)
$1.1473 (1691)
$1.1455 (1448)
$1.1433 (366)
Price at time of writing this review: $1.1318
Support levels (open interest**, contracts):
$1.1279 (3746)
$1.1237 (2844)
$1.1192 (2920)
Comments:
- Overall open interest on the CALL options and PUT options with the expiration date April, 5 is 71132 contracts (according to data from March, 13) with the maximum number of contracts with strike price $1,1500 (4697);
GBP/USD
Resistance levels (open interest**, contracts)
$1.3428 (960)
$1.3407 (1585)
$1.3389 (638)
Price at time of writing this review: $1.3257
Support levels (open interest**, contracts):
$1.3104 (1084)
$1.3074 (668)
$1.3043 (449)
Comments:
- Overall open interest on the CALL options with the expiration date April, 5 is 23592 contracts, with the maximum number of contracts with strike price $1,3400 (4366);
- Overall open interest on the PUT options with the expiration date April, 5 is 25219 contracts, with the maximum number of contracts with strike price $1,2500 (3618);
- The ratio of PUT/CALL was 1.07 versus 1.03 from the previous trading day according to data from March, 13
* - The Chicago Mercantile Exchange bulletin (CME) is used for the calculation.
** - Open interest takes into account the total number of option contracts that are open at the moment.
| Raw materials | Closed | Change, % |
|---|---|---|
| Brent | 67.57 | 1.21 |
| WTI | 58.54 | 2.15 |
| Silver | 15.42 | 0.06 |
| Gold | 1309.073 | 0.62 |
| Palladium | 1551.75 | 0.98 |
| Index | Change, points | Closed | Change, % |
|---|---|---|---|
| NIKKEI 225 | -213.45 | 21290.24 | -0.99 |
| Hang Seng | -113.42 | 28807.45 | -0.39 |
| KOSPI | -8.77 | 2148.41 | -0.41 |
| ASX 200 | -13.6 | 6161.2 | -0.22 |
| FTSE 100 | 8.04 | 7159.19 | 0.11 |
| DAX | 48.24 | 11572.41 | 0.42 |
| Dow Jones | 148.23 | 25702.89 | 0.58 |
| S&P 500 | 19.4 | 2810.92 | 0.69 |
| NASDAQ Composite | 52.38 | 7643.41 | 0.69 |
| Pare | Closed | Change, % |
|---|---|---|
| AUDUSD | 0.7091 | 0.18 |
| EURJPY | 126.071 | 0.32 |
| EURUSD | 1.13297 | 0.38 |
| GBPJPY | 148.086 | 1.74 |
| GBPUSD | 1.33095 | 1.81 |
| NZDUSD | 0.68544 | -0.06 |
| USDCAD | 1.32993 | -0.41 |
| USDCHF | 1.0035 | -0.41 |
| USDJPY | 111.267 | -0.06 |


© 2000-2024. All rights reserved.
This site is managed by Teletrade D.J. LLC 2351 LLC 2022 (Euro House, Richmond Hill Road, Kingstown, VC0100, St. Vincent and the Grenadines).
The information on this website is for informational purposes only and does not constitute any investment advice.
The company does not serve or provide services to customers who are residents of the US, Canada, Iran, The Democratic People's Republic of Korea, Yemen and FATF blacklisted countries.
Making transactions on financial markets with marginal financial instruments opens up wide possibilities and allows investors who are willing to take risks to earn high profits, carrying a potentially high risk of losses at the same time. Therefore you should responsibly approach the issue of choosing the appropriate investment strategy, taking the available resources into account, before starting trading.
Use of the information: full or partial use of materials from this website must always be referenced to TeleTrade as the source of information. Use of the materials on the Internet must be accompanied by a hyperlink to teletrade.org. Automatic import of materials and information from this website is prohibited.
Please contact our PR department if you have any questions or need assistance at pr@teletrade.global.
transfers