- Analytics
- News and Tools
- Market News
CFD Markets News and Forecasts — 12-07-2018
| Raw materials | Closing price | % change |
| Oil | 70.29 | -0.13% |
| Gold | 1,247.30 | +0.23% |
| Index | Change items | Closing price | % change |
| Nikkei | +255.75 | 22187.96 | +1.17% |
| TOPIX | +7.80 | 1709.68 | +0.46% |
| Hang Seng | +169.14 | 28480.83 | +0.60% |
| CSI 300 | +73.53 | 3481.06 | +2.16% |
| Euro Stoxx 50 | +23.14 | 3445.49 | +0.68% |
| FTSE 100 | +59.37 | 7651.33 | +0.78% |
| DAX | +75.84 | 12492.97 | +0.61% |
| CAC 40 | +51.97 | 5405.90 | +0.97% |
| DJIA | +224.44 | 24924.89 | +0.91% |
| S&P 500 | +24.27 | 2798.29 | +0.87% |
| NASDAQ | +107.31 | 7823.92 | +1.39% |
| S&P/TSX | +150.10 | 16567.42 | +0.91% |
| Pare | Closed | % change |
| EUR/USD | $1,1668 | -0,04% |
| GBP/USD | $1,3203 | -0,01% |
| USD/CHF | Chf1,00233 | +0,68% |
| USD/JPY | Y112,52 | +0,53% |
| EUR/JPY | Y131,30 | +0,48% |
| GBP/JPY | Y148,563 | +0,52% |
| AUD/USD | $0,7405 | +0,58% |
| NZD/USD | $0,6774 | +0,36% |
| USD/CAD | C$1,31601 | -0,41% |
| Time | A country | Index | Period | Previous value | Forecast |
| 01:30 | New Zealand | Business NZ PMI | June | 54.5 | |
| 06:00 | China | Trade Balance, bln | June | 24.92 | 27.61 |
| 07:30 | Japan | Industrial Production (YoY) | May | 2.6% | 4.2% |
| 07:30 | Japan | Industrial Production (MoM) | May | 0.5% | -0.2% |
| 10:15 | Switzerland | Producer & Import Prices, y/y | June | 3.2% | 3.2% |
| 11:00 | Eurozone | ECOFIN Meetings | | | |
| 14:00 | United Kingdom | MPC Member Cunliffe Speaks | | | |
| 15:30 | USA | Import Price Index | June | 0.6% | 0.1% |
| 17:00 | USA | Reuters/Michigan Consumer Sentiment Index | July | 98.2 | 98.2 |
| 18:00 | USA | Fed Monetary Policy Report | | | |
| 19:30 | USA | FOMC Member Bostic Speaks | | | |
| 20:00 | USA | Baker Hughes Oil Rig Count | July | 863 | |
Информационно-аналитический отдел TeleTrade
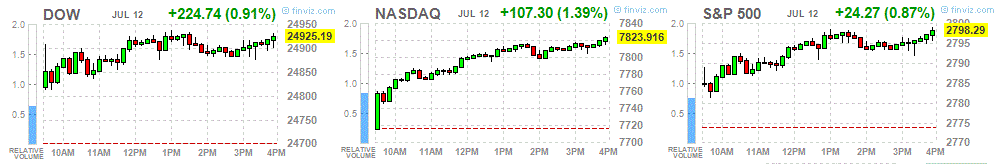
The main US stock indexes have moderately grown, led by the technology sector, as optimism due to the season of reports offset fears of a trade war in the US.
A certain influence on the dynamics of trading was also provided by the US data. The US Department of Labor said that consumer prices rose for the third consecutive month in June, undermining an already slow rise in wages and sending inflation to its highest level in more than six years. The consumer price index (CPI) increased seasonally by 0.1% in June compared with the previous month. Excluding volatile food and energy, prices rose by 0.2%. Economists had expected a 0.2% growth since May for the general index and for the so-called core inflation. The price increase last month led to the cumulative growth of the CPI in June compared to a year earlier to 2.9%, which is the highest since February 2012. Core inflation in June fell to 2.3% compared to the previous year, which is the highest since January 2017.
In addition, a separate report from the Ministry of Labor showed that the number of Americans applying for unemployment benefits fell more than expected last week, reaching a two-month low, which indicates that labor market conditions remained stable in early July. Initial claims for unemployment benefits decreased by 18,000 to 214,000, seasonally adjusted for the week ended July 7, the lowest level since early May. Data on calls for the previous week were revised upward to show 1000 applications more than previously reported.
Most components of DOW are in the black (25 out of 30). Leader of the growth were shares of Cisco Systems, Inc. (CSCO, + 2.36%). Outsider were the shares of The Procter & Gamble Company (PG, -0.47%).
All sectors of S & P finished trading in positive territory. The technological sector grew most (+ 1.6%).
At closing:
Dow 24,924.89 +224.44 +0.91%
S&P 500 2,798.29 +24.2 +0.87%
Nasdaq 100 7,823.92 +107.31 +1.39%
In June 2018, the Consumer Prices Index (CPI) was stable over a month, after an acceleration in May (+0.4% after +0.2% in April). This stability resulted from a rise in energy prices, less markedly than in May (+0.9% after +2.0%), offset by a downturn in food prices (−0.2% after 0.9%). "Manufactured product" prices were unchanged after a 0.3% increase in the previous month. Services prices were also stable after +0.1% in May.
Seasonally adjusted, consumer prices were stable after a slight acceleration to +0.3% in May.
Year on year, consumer prices rose by 2.0%, as in the previous month. This stability in inflation reflected two opposing trends: a sharp year-on-year acceleration in energy prices and, to a lesser extent, in these of food and tobacco, while those of services slowed down. "Manufactured product" prices fell at the same pace as in the previous month.
Canadian new house prices remained unchanged on a national basis in May, for a third consecutive month.
New housing prices were flat or declined in 15 of the 27 census metropolitan areas (CMAs) surveyed in May. Recent mortgage rate hikes, along with tighter mortgage regulations, may have slowed the demand for new homes. The Bank of Canada reported that the rate for a conventional mortgage on a five-year term increased from 5.14% to 5.34% in May.
Toronto new home prices were unchanged in May, following four consecutive months of declines. The Canada Mortgage and Housing Corporation reported that, year to date, housing starts in Toronto were down 36.2% in May compared with the same period in 2017, reflecting a slower pace of construction for row, single and semi-detached new houses
-
Warned of Economic Threats From Rising Protectionism
-
Also Warned of Threats From Renewed Financial Market Risks
-
Worried Trade Tensions May Spark 'More General Decline in Confidence'
In May 2018 compared with April 2018, seasonally adjusted industrial production rose by 1.3% in the euro area (EA19) and by 1.2% in the EU28, according to estimates from Eurostat, the statistical office of the European Union. In April 2018, industrial production fell by 0.8% in both zones. In May 2018 compared with May 2017, industrial production increased by 2.4% in both zones.
The increase of 1.3% in industrial production in the euro area in May 2018, compared with April 2018, is due to production of both durable and non-durable consumer goods rising by 2.1%, intermediate goods by 1.6%, capital goods by 0.7% and energy by 0.5%.
In the week ending July 7, the advance figure for seasonally adjusted initial claims was 214,000, a decrease of 18,000 from the previous week's revised level. The previous week's level was revised up by 1,000 from 231,000 to 232,000. The 4-week moving average was 223,000, a decrease of 1,750 from the previous week's revised average. The previous week's average was revised up by 250 from 224,500 to 224,750.
The Consumer Price Index for All Urban Consumers (CPI-U) increased 0.1 percent in June on a seasonally adjusted basis after rising 0.2 percent in May, the U.S. Bureau of Labor Statistics reported today. Over the last 12 months, the all items index rose 2.9 percent before seasonal adjustment.
The indexes for shelter, gasoline, and food all rose to lead to the seasonally adjusted increase in the all items index. The food index increased 0.2 percent in June, with the indexes for food at home and food away from home both rising 0.2 percent. Despite a 0.5-percent increase in the gasoline index, the energy index declined 0.3 percent, with the indexes for electricity and natural gas both falling.
The index for all items less food and energy rose 0.2 percent in June. The shelter index rose 0.1 percent, and the indexes for medical care, used cars and trucks, new vehicles, and recreation all increased. The indexes for apparel, airline fares, and household furnishings and operations all declined in June.
U.S. stock-index futures rose slightly on Thursday, bouncing back after a bruising sell-off a day earlier, which was triggered by the U.S. threats of new tariffs on another $200 billion in Chinese imports.
Global Stocks:
| Index/commodity | Last | Today's Change, points | Today's Change, % |
| Nikkei | 22,187.96 | +255.75 | +1.17% |
| Hang Seng | 28,480.83 | +169.14 | +0.60% |
| Shanghai | 2,838.30 | +60.53 | +2.18% |
| S&P/ASX | 6,268.30 | +52.70 | +0.85% |
| FTSE | 7,653.66 | +61.70 | +0.81% |
| CAC | 5,395.81 | +41.88 | +0.78% |
| DAX | 12,465.14 | +48.01 | +0.39% |
| Crude | $70.97 | | +0.84% |
| Gold | $1,245.00 | | +0.05% |
Wall Street. Stocks before the bell
(company / ticker / price / change ($/%) / volume)
| ALCOA INC. | AA | 48.25 | 0.19(0.40%) | 3140 |
| ALTRIA GROUP INC. | MO | 58.8 | 0.11(0.19%) | 3400 |
| Amazon.com Inc., NASDAQ | AMZN | 1,764.82 | 9.82(0.56%) | 52027 |
| American Express Co | AXP | 100.79 | 0.49(0.49%) | 680 |
| Apple Inc. | AAPL | 189.26 | 1.38(0.73%) | 83163 |
| AT&T Inc | T | 32 | 0.13(0.41%) | 61867 |
| Barrick Gold Corporation, NYSE | ABX | 12.95 | 0.03(0.23%) | 21212 |
| Boeing Co | BA | 343.9 | 3.30(0.97%) | 24472 |
| Caterpillar Inc | CAT | 138.2 | 1.44(1.05%) | 15652 |
| Chevron Corp | CVX | 124.49 | 0.97(0.79%) | 5371 |
| Cisco Systems Inc | CSCO | 42.75 | 0.18(0.42%) | 5949 |
| Citigroup Inc., NYSE | C | 68.43 | 0.52(0.77%) | 51162 |
| Exxon Mobil Corp | XOM | 83.09 | 0.50(0.61%) | 4806 |
| Facebook, Inc. | FB | 203.43 | 0.89(0.44%) | 85334 |
| FedEx Corporation, NYSE | FDX | 233.25 | 3.03(1.32%) | 365 |
| Ford Motor Co. | F | 11.11 | 0.04(0.36%) | 14778 |
| Freeport-McMoRan Copper & Gold Inc., NYSE | FCX | 17.72 | 0.36(2.07%) | 74991 |
| General Electric Co | GE | 14.13 | 0.14(1.00%) | 230485 |
| General Motors Company, NYSE | GM | 39.5 | 0.20(0.51%) | 7080 |
| Goldman Sachs | GS | 228.7 | 3.04(1.35%) | 1091 |
| Google Inc. | GOOG | 1,160.30 | 6.40(0.55%) | 3262 |
| Home Depot Inc | HD | 197.86 | 0.91(0.46%) | 1437 |
| Intel Corp | INTC | 51.57 | 0.37(0.72%) | 25081 |
| International Business Machines Co... | IBM | 145.5 | 0.56(0.39%) | 2277 |
| International Paper Company | IP | 54.11 | 1.24(2.34%) | 150 |
| Johnson & Johnson | JNJ | 127.41 | 1.17(0.93%) | 6539 |
| JPMorgan Chase and Co | JPM | 107.24 | 0.85(0.80%) | 17563 |
| McDonald's Corp | MCD | 159.53 | 0.91(0.57%) | 2660 |
| Microsoft Corp | MSFT | 102.6 | 0.62(0.61%) | 44374 |
| Nike | NKE | 77.71 | 0.35(0.45%) | 1255 |
| Pfizer Inc | PFE | 37.38 | 0.17(0.46%) | 5219 |
| Procter & Gamble Co | PG | 79.39 | 0.23(0.29%) | 1840 |
| Starbucks Corporation, NASDAQ | SBUX | 50.46 | 0.32(0.64%) | 693 |
| Tesla Motors, Inc., NASDAQ | TSLA | 321.67 | 2.71(0.85%) | 45626 |
| The Coca-Cola Co | KO | 44.9 | 0.11(0.25%) | 1188 |
| Twitter, Inc., NYSE | TWTR | 44.97 | 1.10(2.51%) | 396684 |
| United Technologies Corp | UTX | 125.49 | 0.61(0.49%) | 123 |
| UnitedHealth Group Inc | UNH | 257 | 2.41(0.95%) | 2333 |
| Verizon Communications Inc | VZ | 51.6 | 0.26(0.51%) | 3501 |
| Visa | V | 139.64 | 1.49(1.08%) | 7276 |
| Wal-Mart Stores Inc | WMT | 86.93 | 0.40(0.46%) | 2508 |
| Walt Disney Co | DIS | 108.55 | 0.51(0.47%) | 1146 |
| Yandex N.V., NASDAQ | YNDX | 36.98 | 0.25(0.68%) | 481 |
Honeywell (HON) coverage resumed with Buy at Deutsche Bank
General Electric (GE) upgraded to Hold from Sell at Deutsche Bank
Johnson & Johnson (JNJ) upgraded to Neutral from Sell at Goldman
EUR/USD
Resistance levels (open interest**, contracts)
$1.1852 (2238)
$1.1799 (2603)
$1.1756 (155)
Price at time of writing this review: $1.1679
Support levels (open interest**, contracts):
$1.1631 (3122)
$1.1599 (3006)
$1.1563 (4467)
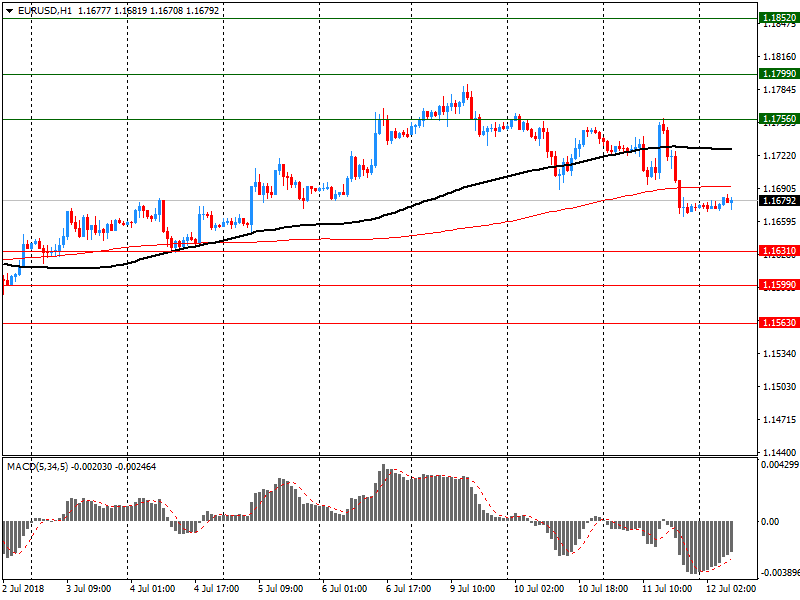
Comments:
- Overall open interest on the CALL options and PUT options with the expiration date August, 13 is 83043 contracts (according to data from July, 11) with the maximum number of contracts with strike price $1,1850 (5027);
GBP/USD
Resistance levels (open interest**, contracts)
$1.3335 (661)
$1.3302 (669)
$1.3280 (287)
Price at time of writing this review: $1.3208
Support levels (open interest**, contracts):
$1.3166 (1546)
$1.3142 (1441)
$1.3113 (2061)
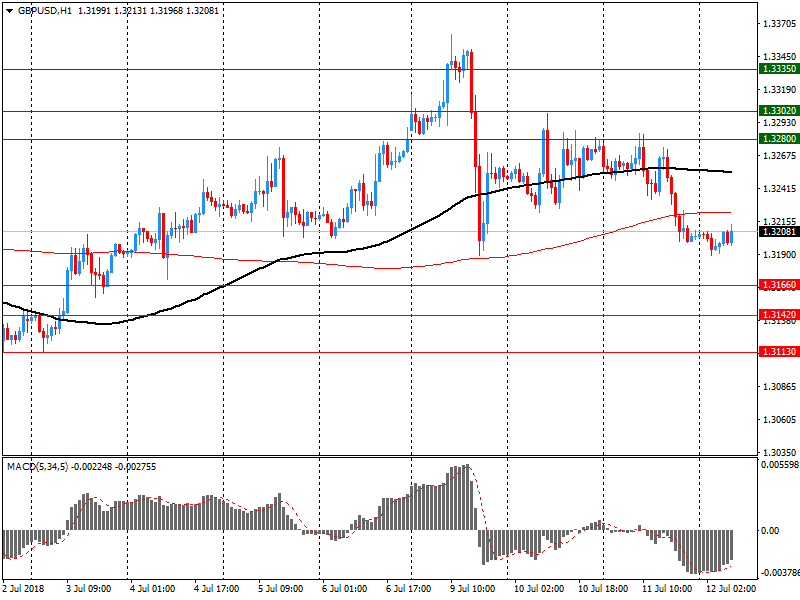
Comments:
- Overall open interest on the CALL options with the expiration date August, 13 is 22051 contracts, with the maximum number of contracts with strike price $1,3600 (3174);
- Overall open interest on the PUT options with the expiration date August, 13 is 25474 contracts, with the maximum number of contracts with strike price $1,3100 (2522);
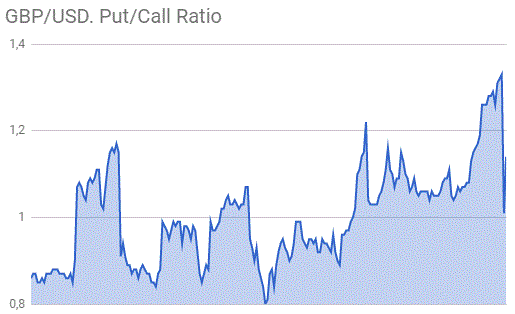
- The ratio of PUT/CALL was 1.16 versus 1.16 from the previous trading day according to data from July, 11.
* - The Chicago Mercantile Exchange bulletin (CME) is used for the calculation.
** - Open interest takes into account the total number of option contracts that are open at the moment.


© 2000-2024. All rights reserved.
This site is managed by Teletrade D.J. LLC 2351 LLC 2022 (Euro House, Richmond Hill Road, Kingstown, VC0100, St. Vincent and the Grenadines).
The information on this website is for informational purposes only and does not constitute any investment advice.
The company does not serve or provide services to customers who are residents of the US, Canada, Iran, The Democratic People's Republic of Korea, Yemen and FATF blacklisted countries.
Making transactions on financial markets with marginal financial instruments opens up wide possibilities and allows investors who are willing to take risks to earn high profits, carrying a potentially high risk of losses at the same time. Therefore you should responsibly approach the issue of choosing the appropriate investment strategy, taking the available resources into account, before starting trading.
Use of the information: full or partial use of materials from this website must always be referenced to TeleTrade as the source of information. Use of the materials on the Internet must be accompanied by a hyperlink to teletrade.org. Automatic import of materials and information from this website is prohibited.
Please contact our PR department if you have any questions or need assistance at pr@teletrade.global.
transfers