- Analytics
- News and Tools
- Market News
CFD Markets News and Forecasts — 09-05-2018
| raw materials | closing price | % change |
| Oil | 71.24 | +3.16% |
| Gold | 1,312.80 | -0.07% |
| index | closing price | change items | % change |
| Nikkei | -99.81 | 22408.88 | -0.44% |
| TOPIX | -6.91 | 1772.91 | -0.39% |
| Hang Seng | +133.33 | 30536.14 | +0.44% |
| CSI 300 | -7.06 | 3871.62 | -0.18% |
| Euro Stoxx 50 | +11.86 | 3569.74 | +0.33% |
| FTSE 100 | +96.77 | 7662.52 | +1.28% |
| DAX | +30.85 | 12943.06 | +0.24% |
| CAC 40 | +12.70 | 5534.63 | +0.23% |
| DJIA | +182.33 | 24542.54 | +0.75% |
| S&P 500 | +25.87 | 2697.79 | +0.97% |
| NASDAQ | +73.00 | 7339.91 | +1.00% |
| S&P/TSX | +68.10 | 15910.81 | +0.43% |
| Pare | Closed | % change |
| EUR/USD | $1,1851 | -0,08% |
| GBP/USD | $1,3545 | +0,00% |
| USD/CHF | Chf1,00473 | +0,33% |
| USD/JPY | Y109,72 | +0,61% |
| EUR/JPY | Y130,04 | +0,52% |
| GBP/JPY | Y148,627 | +0,61% |
| AUD/USD | $0,7460 | +0,12% |
| NZD/USD | $0,6940 | -0,42% |
| USD/CAD | C$1,28525 | -0,74% |
| Time | Region | Event | Period | Previous | Forecast |
| 00:00 | New Zealand | RBNZ Interest Rate Decision | | 1.75% | 1.75% |
| 00:00 | New Zealand | RBNZ Rate Statement | | | |
| 01:00 | New Zealand | RBNZ Press Conferenc | | | |
| 02:50 | Japan | Current Account, bln | March | 2.076 | 3009.2 |
| 04:00 | Australia | Consumer Inflation Expectation | May | 3.6% | |
| 04:30 | China | PPI y/y | April | 3.1% | 3.5% |
| 04:30 | China | CPI y/y | April | 2.1% | 1.9% |
| 08:00 | Japan | Eco Watchers Survey: Outlook | March | 49.6 | 49.2 |
| 08:00 | Japan | Eco Watchers Survey: Current | April | 48.9 | 47.3 |
| 11:00 | Eurozone | ECB Economic Bulletin | | | |
| 11:30 | United Kingdom | Industrial Production (YoY) | | 2.2% | 3.1% |
| 11:30 | United Kingdom | Manufacturing Production (MoM) | | -0.2% | -0.2% |
| 11:30 | United Kingdom | Manufacturing Production (YoY) | March | 2.5% | 2.9% |
| 11:30 | United Kingdom | Industrial Production (MoM) | March | 0.1% | 0.2% |
| 11:30 | United Kingdom | Total Trade Balance | March | -0.965 | |
| 14:00 | United Kingdom | BoE Interest Rate Decision | March | 0.5% | 0.5% |
| 14:00 | United Kingdom | Asset Purchase Facility | March | 435 | 435 |
| 14:00 | United Kingdom | BOE Inflation Letter | | | |
| 14:00 | United Kingdom | Bank of England Minutes | | | |
| 14:30 | United Kingdom | BOE Gov Mark Carney Speaks | | | |
| 15:00 | United Kingdom | NIESR GDP Estimate | April | 0.2% | 0.3% |
| 15:30 | Canada | New Housing Price Index, MoM | March | -0.2% | 0.2% |
| 15:30 | Canada | New Housing Price Index, YoY | March | 2.6% | |
| 15:30 | USA | Continuing Jobless Claims | April | 1756 | 1778 |
| 15:30 | USA | Initial Jobless Claims | May | 211 | 218 |
| 15:30 | USA | CPI, m/m | April | -0.1% | 0.3% |
| 15:30 | USA | CPI excluding food and energy, m/m | April | 0.2% | 0.2% |
| 15:30 | USA | CPI, Y/Y | April | 2.4% | 2.5% |
| 15:30 | USA | CPI excluding food and energy, Y/Y | April | 2.1% | 2.2% |
| 21:00 | USA | Federal budget | April | -209 | 193.75 |
Major US stock indices rose on Wednesday amid rising oil prices after Donald Trump pulled the United States out of a nuclear deal with Iran.
In addition, as it became known, wholesale stocks in the US increased less than originally expected in March, amid a decline in car stocks and a number of other goods. The Ministry of Commerce said on Wednesday that wholesale stocks rose 0.3% instead of 0.5%, which it reported last month. Stocks of wholesalers in February rose by 0.9%. The component of wholesale stocks, which goes into the calculation of gross domestic product - wholesale stocks, excluding auto, - increased by 0.4% in March.
At the same time, producer prices in the US increased slightly last month, becoming a possible sign that inflationary pressures remain relatively modest in the economy. The producer price index, a measure of the prices charged by companies for their goods and services, increased seasonally by 0.1% in April compared with the previous month, the Ministry of Labor said on Wednesday. Economists forecast an increase of 0.2%. Since last year, producer prices have increased by 2.6% last month, which is the smallest annual increase since December.
Oil prices rose by almost 3%, reaching 3.5-year highs, after US President Trump refused a nuclear deal with Iran and announced the imposition of economic sanctions against a member of OPEC at "the highest level"
Most DOW components are in the black (22 out of 30). The leader of growth was the shares of DowDuPont Inc. (DWDP, + 2.82%). Outsider were shares Walmart Inc. (WMT, -3.14%).
Almost all sectors of S & P completed the auction in positive territory. The commodities sector grew most (+ 2.2%). The decrease was shown only by the utilities sector (-0.5%).
At closing:
Index
Dow 24,542.54 +182.33 +0.75%
S&P 500 2,697.79 +25.87 +0.97%
Nasdaq 100 7,339.90 +73.00 +1.00%
U.S. commercial crude oil inventories (excluding those in the Strategic Petroleum Reserve) decreased by 2.2 million barrels from the previous week. At 433.8 million barrels, U.S. crude oil inventories are in the lower half of the average range for this time of year.
Total motor gasoline inventories decreased by 2.2 million barrels last week, and are in the upper half of the average range. Both finished gasoline inventories and blending components inventories decreased last week.
Distillate fuel inventories decreased by 3.8 million barrels last week and are in the lower half of the average range for this time of year. Propane/propylene inventories increased by 2.3 million barrels last week, and are in the lower half of the average range. Total commercial petroleum inventories decreased by 1.5 million barrels last week.
Total inventories of merchant wholesalers, except manufacturers' sales branches and offices, after adjustment for seasonal variations but not for price changes, were $627.4 billion at the end of March, up 0.3 percent from the revised February level. Total inventories were up 5.5 percent from the revised March 2017 level. The February 2018 to March 2018 percent change was revised from the advance estimate of up 0.5 percent to up 0.3 percent (±0.2 percent).
The March inventories/sales ratio for merchant wholesalers, except manufacturers' sales branches and offices, based on seasonally adjusted data, was 1.26. The March 2017 ratio was 1.28.
"I am pleased to inform you that Secretary of State Mike Pompeo is in the air and on his way back from North Korea with the 3 wonderful gentlemen that everyone is looking so forward to meeting. They seem to be in good health. Also, good meeting with Kim Jong Un. Date & Place set."
U.S. stock-index futures rose on Wednesday, as energy stocks surged on oil rally, triggered by the U.S. president Donald Trump's decision to pull his country out of the Iran nuclear deal, and reimpose sanctions against Tehran.
Global Stocks:
| Index/commodity | Last | Today's Change, points | Today's Change, % |
| Nikkei | 22,408.88 | -99.81 | -0.44% |
| Hang Seng | 30,536.14 | +133.33 | +0.44% |
| Shanghai | 3,158.81 | -2.68 | -0.08% |
| S&P/ASX | 6,108.00 | +16.10 | +0.26% |
| FTSE | 7,602.77 | +37.02 | +0.49% |
| CAC | 5,517.48 | -4.45 | -0.08% |
| DAX | 12,906.53 | -5.68 | -0.04% |
| Crude | $70.74 | | +2.43% |
| Gold | $1,313.20 | | -0.04% |
The value of building permits issued by Canadian municipalities increased 3.1% to $8.4 billion in March, following a 2.8% decline in February. The rise was mainly the result of higher construction intentions for multi-family dwellings, particularly in Quebec and British Columbia, and, to a lesser extent, by the commercial component.
Municipalities issued $5.4 billion worth of residential building permits in March, up 2.3% from February. A notable increase in the multi-family component more than offset lower construction intentions for single-family dwellings. Although eight provinces reported declines in the residential sector in March, higher construction intentions in Quebec (+$373.8 million) and British Columbia (+$179.5 million) raised the national total.
The Producer Price Index for final demand rose 0.1 percent in April, seasonally adjusted, the U.S. Bureau of Labor Statistics reported today. Final demand prices advanced 0.3 percent in March and 0.2 percent in February. On an unadjusted basis, the final demand index increased 2.6 percent for the 12 months ended in April.
In April, the index for final demand services advanced 0.1 percent, and prices for final demand goods were unchanged.
The index for final demand less foods, energy, and trade services edged up 0.1 percent in April after increasing 0.4 percent in March. For the 12 months ended in April, prices for final demand less foods, energy, and trade services advanced 2.5 percent.
(company / ticker / price / change ($/%) / volume)
| Amazon.com Inc., NASDAQ | AMZN | 1,603.79 | 11.40(0.72%) | 49061 |
| Google Inc. | GOOG | 1,057.50 | 3.59(0.34%) | 2295 |
| 3M Co | MMM | 202.9 | 1.16(0.58%) | 522 |
| Apple Inc. | AAPL | 186.62 | 0.57(0.31%) | 130807 |
| AT&T Inc | T | 31.75 | 0.05(0.16%) | 45308 |
| Barrick Gold Corporation, NYSE | ABX | 13.25 | -0.03(-0.23%) | 27880 |
| Boeing Co | BA | 340.3 | 1.93(0.57%) | 18703 |
| Caterpillar Inc | CAT | 150.85 | 0.92(0.61%) | 7132 |
| Chevron Corp | CVX | 128 | 1.43(1.13%) | 8902 |
| Cisco Systems Inc | CSCO | 45.89 | 0.18(0.39%) | 13996 |
| Citigroup Inc., NYSE | C | 71.26 | 0.26(0.37%) | 11097 |
| Deere & Company, NYSE | DE | 143 | 0.93(0.65%) | 1400 |
| Exxon Mobil Corp | XOM | 78.95 | 0.86(1.10%) | 23602 |
| Facebook, Inc. | FB | 179.35 | 0.43(0.24%) | 68317 |
| Ford Motor Co. | F | 11.23 | -0.04(-0.35%) | 122354 |
| Freeport-McMoRan Copper & Gold Inc., NYSE | FCX | 15.38 | 0.08(0.52%) | 13500 |
| General Electric Co | GE | 14.4 | 0.13(0.91%) | 120128 |
| General Motors Company, NYSE | GM | 36.49 | 0.16(0.44%) | 1095 |
| Goldman Sachs | GS | 238.92 | 1.92(0.81%) | 27913 |
| Hewlett-Packard Co. | HPQ | 21.92 | -0.04(-0.18%) | 1872 |
| Home Depot Inc | HD | 185.6 | 0.56(0.30%) | 1641 |
| HONEYWELL INTERNATIONAL INC. | HON | 144.6 | 0.37(0.26%) | 400 |
| Intel Corp | INTC | 53.79 | 0.16(0.30%) | 16078 |
| International Business Machines Co... | IBM | 142.18 | 0.75(0.53%) | 4943 |
| Johnson & Johnson | JNJ | 123 | 0.39(0.32%) | 1806 |
| JPMorgan Chase and Co | JPM | 111.5 | 0.51(0.46%) | 10044 |
| McDonald's Corp | MCD | 165.58 | 0.81(0.49%) | 1824 |
| Microsoft Corp | MSFT | 96.1 | 0.29(0.30%) | 85420 |
| Nike | NKE | 68.54 | 0.08(0.12%) | 822 |
| Pfizer Inc | PFE | 35.2 | 0.22(0.63%) | 1341 |
| Procter & Gamble Co | PG | 71.74 | 0.30(0.42%) | 7026 |
| Starbucks Corporation, NASDAQ | SBUX | 57.58 | 0.21(0.37%) | 16198 |
| Tesla Motors, Inc., NASDAQ | TSLA | 303 | 1.03(0.34%) | 31193 |
| The Coca-Cola Co | KO | 41.93 | 0.12(0.29%) | 5180 |
| Twitter, Inc., NYSE | TWTR | 31.98 | 0.13(0.41%) | 59313 |
| United Technologies Corp | UTX | 122.5 | 0.71(0.58%) | 1572 |
| UnitedHealth Group Inc | UNH | 233 | 0.97(0.42%) | 489 |
| Verizon Communications Inc | VZ | 47.22 | 0.20(0.43%) | 8632 |
| Visa | V | 130.2 | 0.30(0.23%) | 7613 |
| Wal-Mart Stores Inc | WMT | 81.72 | -4.02(-4.69%) | 1611291 |
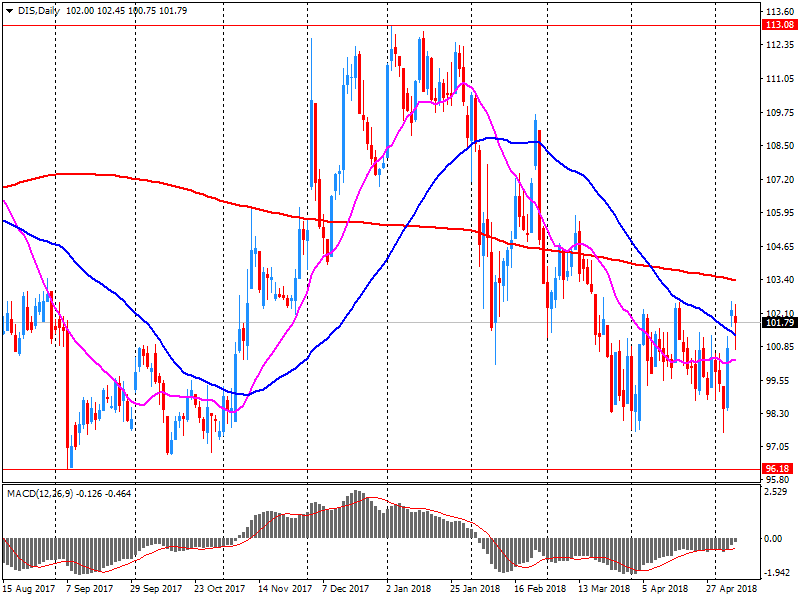
| Walt Disney Co | DIS | 101.1 | -0.69(-0.68%) | 94685 |
Walt Disney (DIS) target lowered to $123 from $125 at B. Riley FBR
Walt Disney (DIS) reported Q2 FY 2018 earnings of $1.84 per share (versus $1.50 in Q2 FY 2017), beating analysts' consensus estimate of $1.70.
The company's quarterly revenues amounted to $14.548 bln (+9.1% y/y), beating analysts' consensus estimate of $14.113 bln.
DIS fell to $101.00 (-0.78%) in pre-market trading.
-
Would like to establish bilateral relations with China where top leaders can easily visit each other
-
North Korea, if it takes the right path, can achieve economic development with its rich natural resources and hard-working people
In March 2018, the value and volume of retail trade continued to grow at a modest pace, both increasing by 2.9% compared with March 2017.
The 3 months to March (Quarter 1) shows a decrease of 0.3% in terms of value and volume; the second consecutive fall in the quarterly movement.
Month-on-month, the value of retail trade was estimated to have fallen by 0.2%, while the quantity sold dropped by 0.6%.
In March 2018, internet sales and small scale distribution saw a contraction when compared with March 2017 (respectively -0.3% and -1.3%), while large scale distribution saw a strong growth year-on-year (+7.0%).
EUR/USD
Resistance levels (open interest**, contracts)
$1.2022 (710)
$1.1972 (292)
$1.1937 (201)
Price at time of writing this review: $1.1834
Support levels (open interest**, contracts):
$1.1795 (3667)
$1.1768 (2787)
$1.1737 (2671)
Comments:
- Overall open interest on the CALL options and PUT options with the expiration date June, 8 is 145542 contracts (according to data from May, 8) with the maximum number of contracts with strike price $1,1500 (9650);
GBP/USD
Resistance levels (open interest**, contracts)
$1.3734 (1330)
$1.3679 (430)
$1.3637 (663)
Price at time of writing this review: $1.3514
Support levels (open interest**, contracts):
$1.3454 (626)
$1.3430 (1460)
$1.3402 (2284)
Comments:
- Overall open interest on the CALL options with the expiration date June, 8 is 35999 contracts, with the maximum number of contracts with strike price $1,3700 (2186);
- Overall open interest on the PUT options with the expiration date June, 8 is 39132 contracts, with the maximum number of contracts with strike price $1,3400 (2506);
- The ratio of PUT/CALL was 1.09 versus 1.07 from the previous trading day according to data from May, 8.
* - The Chicago Mercantile Exchange bulletin (CME) is used for the calculation.
** - Open interest takes into account the total number of option contracts that are open at the moment.
In March 2018, output was virtually stable in the manufacturing industry (+0.1%, after −0.5% in February). It slipped back in the whole industry (−0.4% after +1.1%), due to a strong decrease in mining and carrying, energy, water supply.
Output decreased sharply over the first quarter of 2018 in the manufacturing industry (−1.8%) as well as in the overall industry (−1.3%).
Output went down markedly in "other manufacturing" (−2.3%), in the manufacture of transport equipment (−3.8%) and in the manufacture of coke and refined petroleum products (−1.5%). Conversely, it increased in mining and quarrying, energy, water supply (+1.2%). It rose slightly in the manufacture of food products and beverages (+0.3%) and in the manufacture of machinery and equipment goods (+0.2%)
-
U.S. is committed to working with N.Korea to achieve peace on Korean peninsula
-
Says Trump's decision on nuclear deal with powers a threat to international peace and security
-
Iran has no obligation to honour its commitments under nuclear deal
-
Biggest damage of Iran deal was legitimizing and sitting at negotiating table with America


© 2000-2024. All rights reserved.
This site is managed by Teletrade D.J. LLC 2351 LLC 2022 (Euro House, Richmond Hill Road, Kingstown, VC0100, St. Vincent and the Grenadines).
The information on this website is for informational purposes only and does not constitute any investment advice.
The company does not serve or provide services to customers who are residents of the US, Canada, Iran, The Democratic People's Republic of Korea, Yemen and FATF blacklisted countries.
Making transactions on financial markets with marginal financial instruments opens up wide possibilities and allows investors who are willing to take risks to earn high profits, carrying a potentially high risk of losses at the same time. Therefore you should responsibly approach the issue of choosing the appropriate investment strategy, taking the available resources into account, before starting trading.
Use of the information: full or partial use of materials from this website must always be referenced to TeleTrade as the source of information. Use of the materials on the Internet must be accompanied by a hyperlink to teletrade.org. Automatic import of materials and information from this website is prohibited.
Please contact our PR department if you have any questions or need assistance at pr@teletrade.global.
transfers